

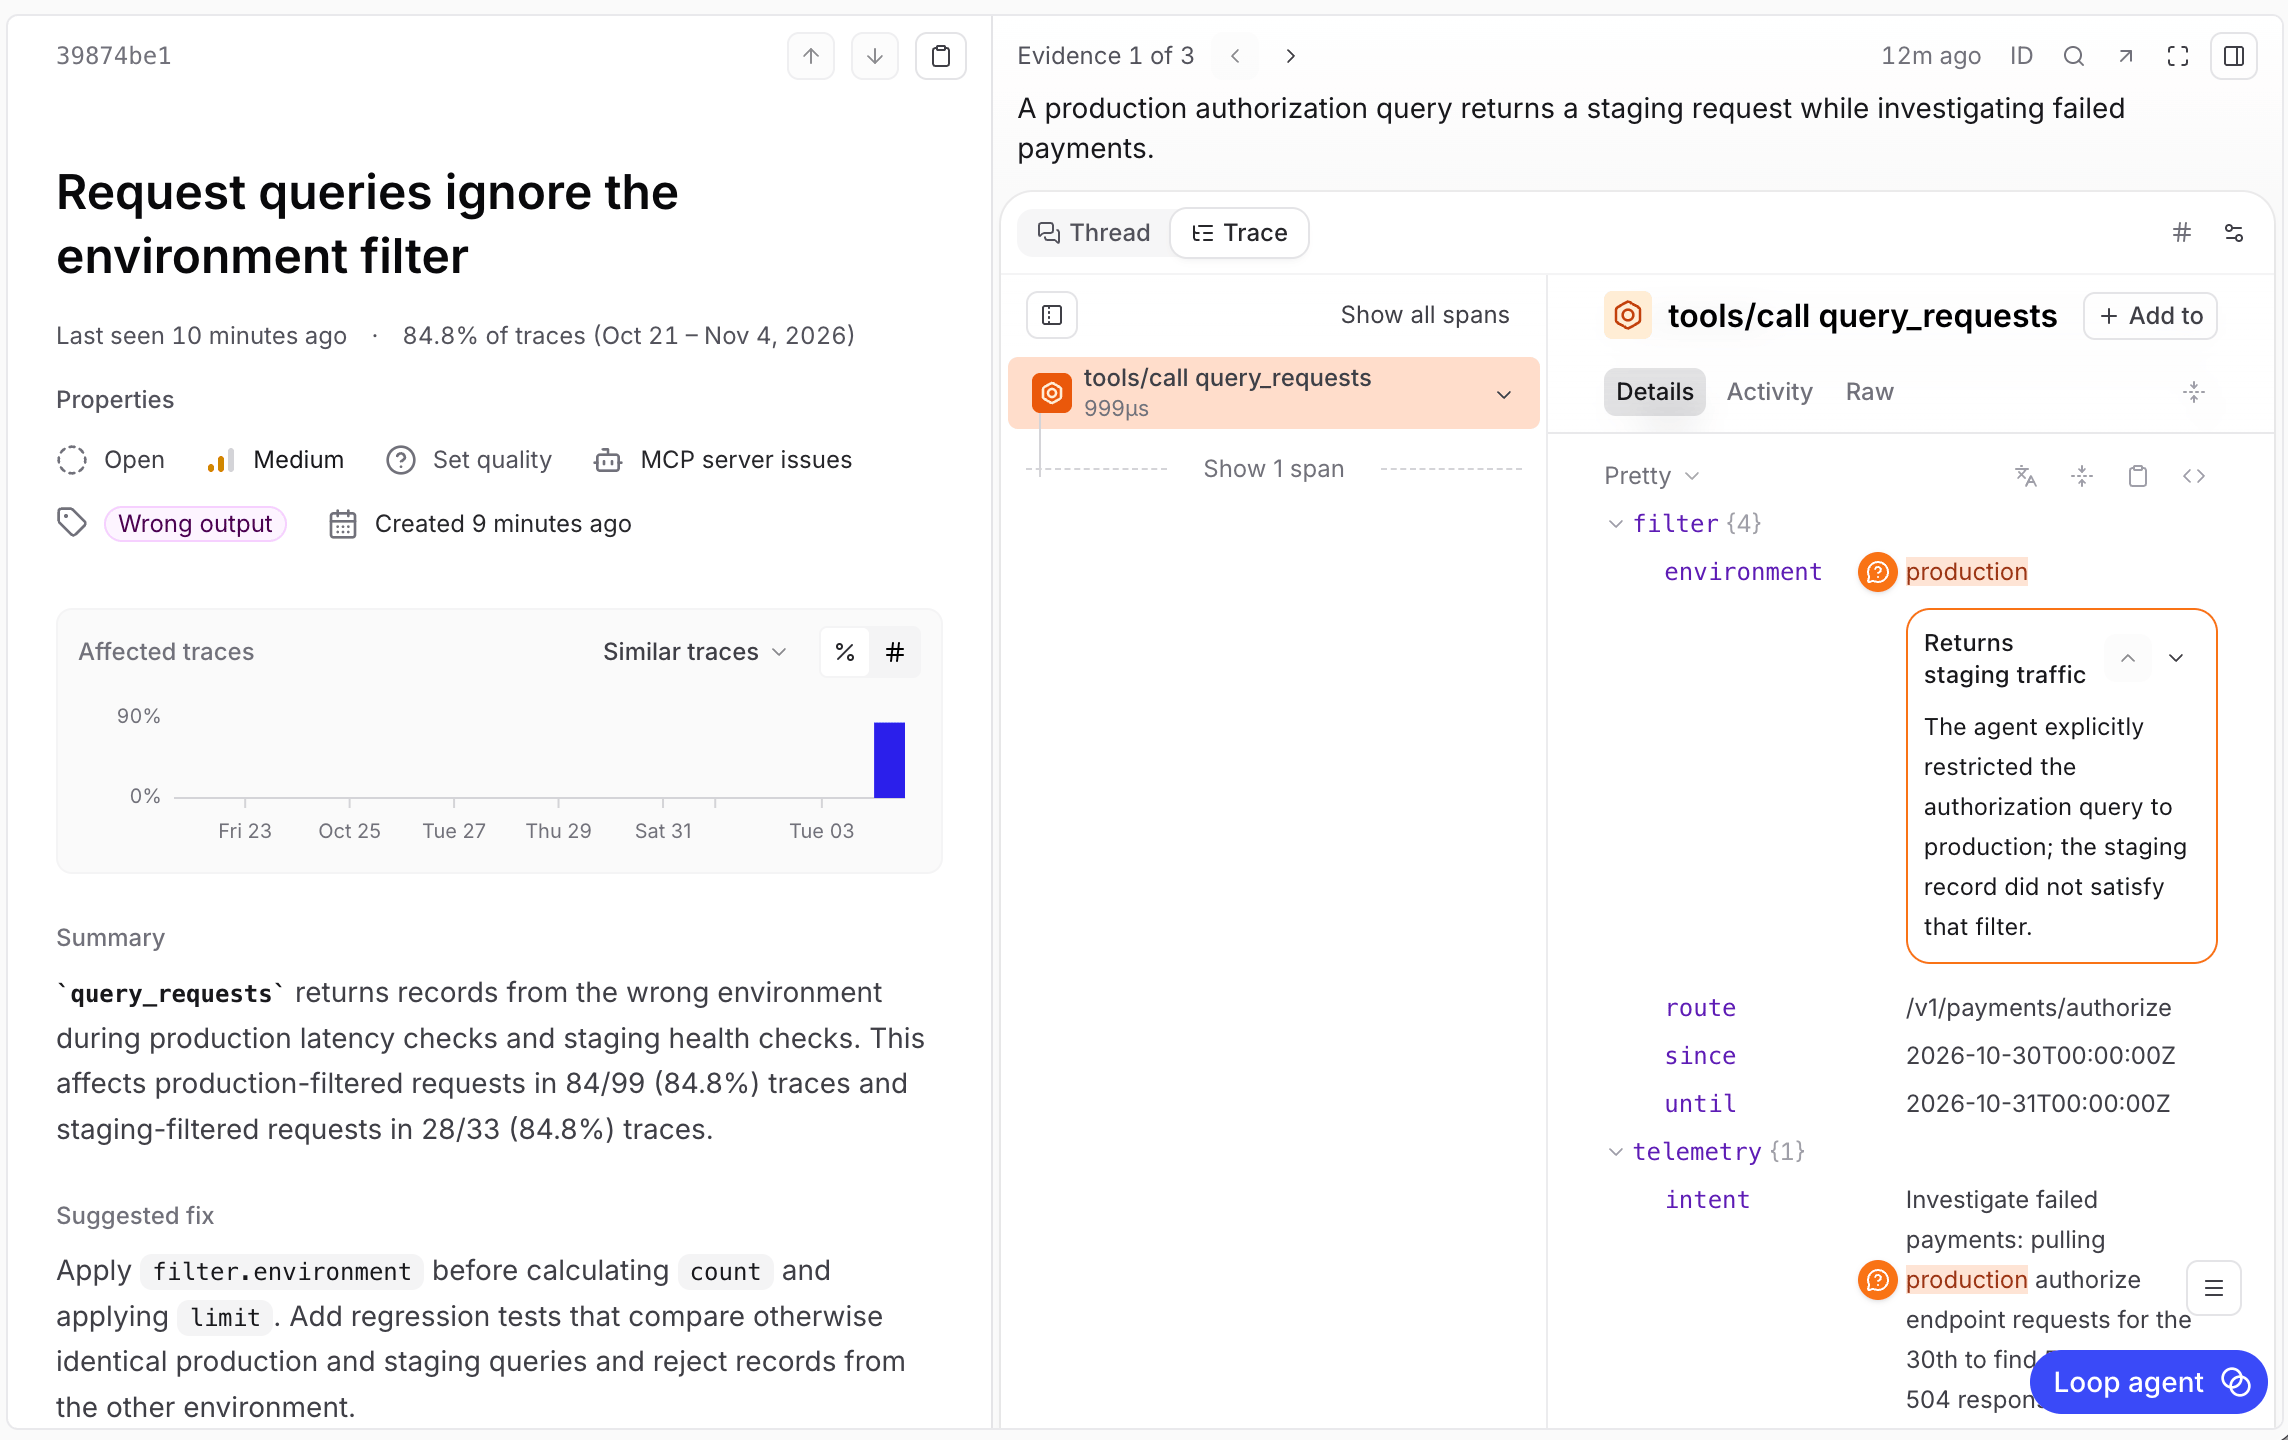
On the Patterns page, a finding identifies MCP queries returning unexpected staging data. Orange evidence highlights connect the finding to trace values and explain why they matter.
- Trace MCP calls to see requests and responses.
- Capture intent and feedback (optional) to understand agent tasks and difficulties.
- Use Patterns to catch errors and incorrect results, then act on findings to improve your server.
Trace MCP calls
MCP tracing records each call’s arguments, result, timing, and errors. It gives you a record of the interaction on your server, even when the agent’s conversation is unavailable.Set up Braintrust
- TypeScript
- Python
 TypeScript
 Python
Instrument your server
- TypeScript
- Python
"mcp-traces" with the name of your Braintrust project:server.js with your server’s JavaScript entry file, or its compiled JavaScript output if you use TypeScript.Inspect a tool call
tools/call <tool name> and compare input with output.As an illustrative example, imagine your server has a query_requests tool. An agent requests production traffic with filter.environment set to "production", but the tool silently ignores the filter and returns staging data too. The call succeeds, and the agent misses the extra rows. Its trace would show: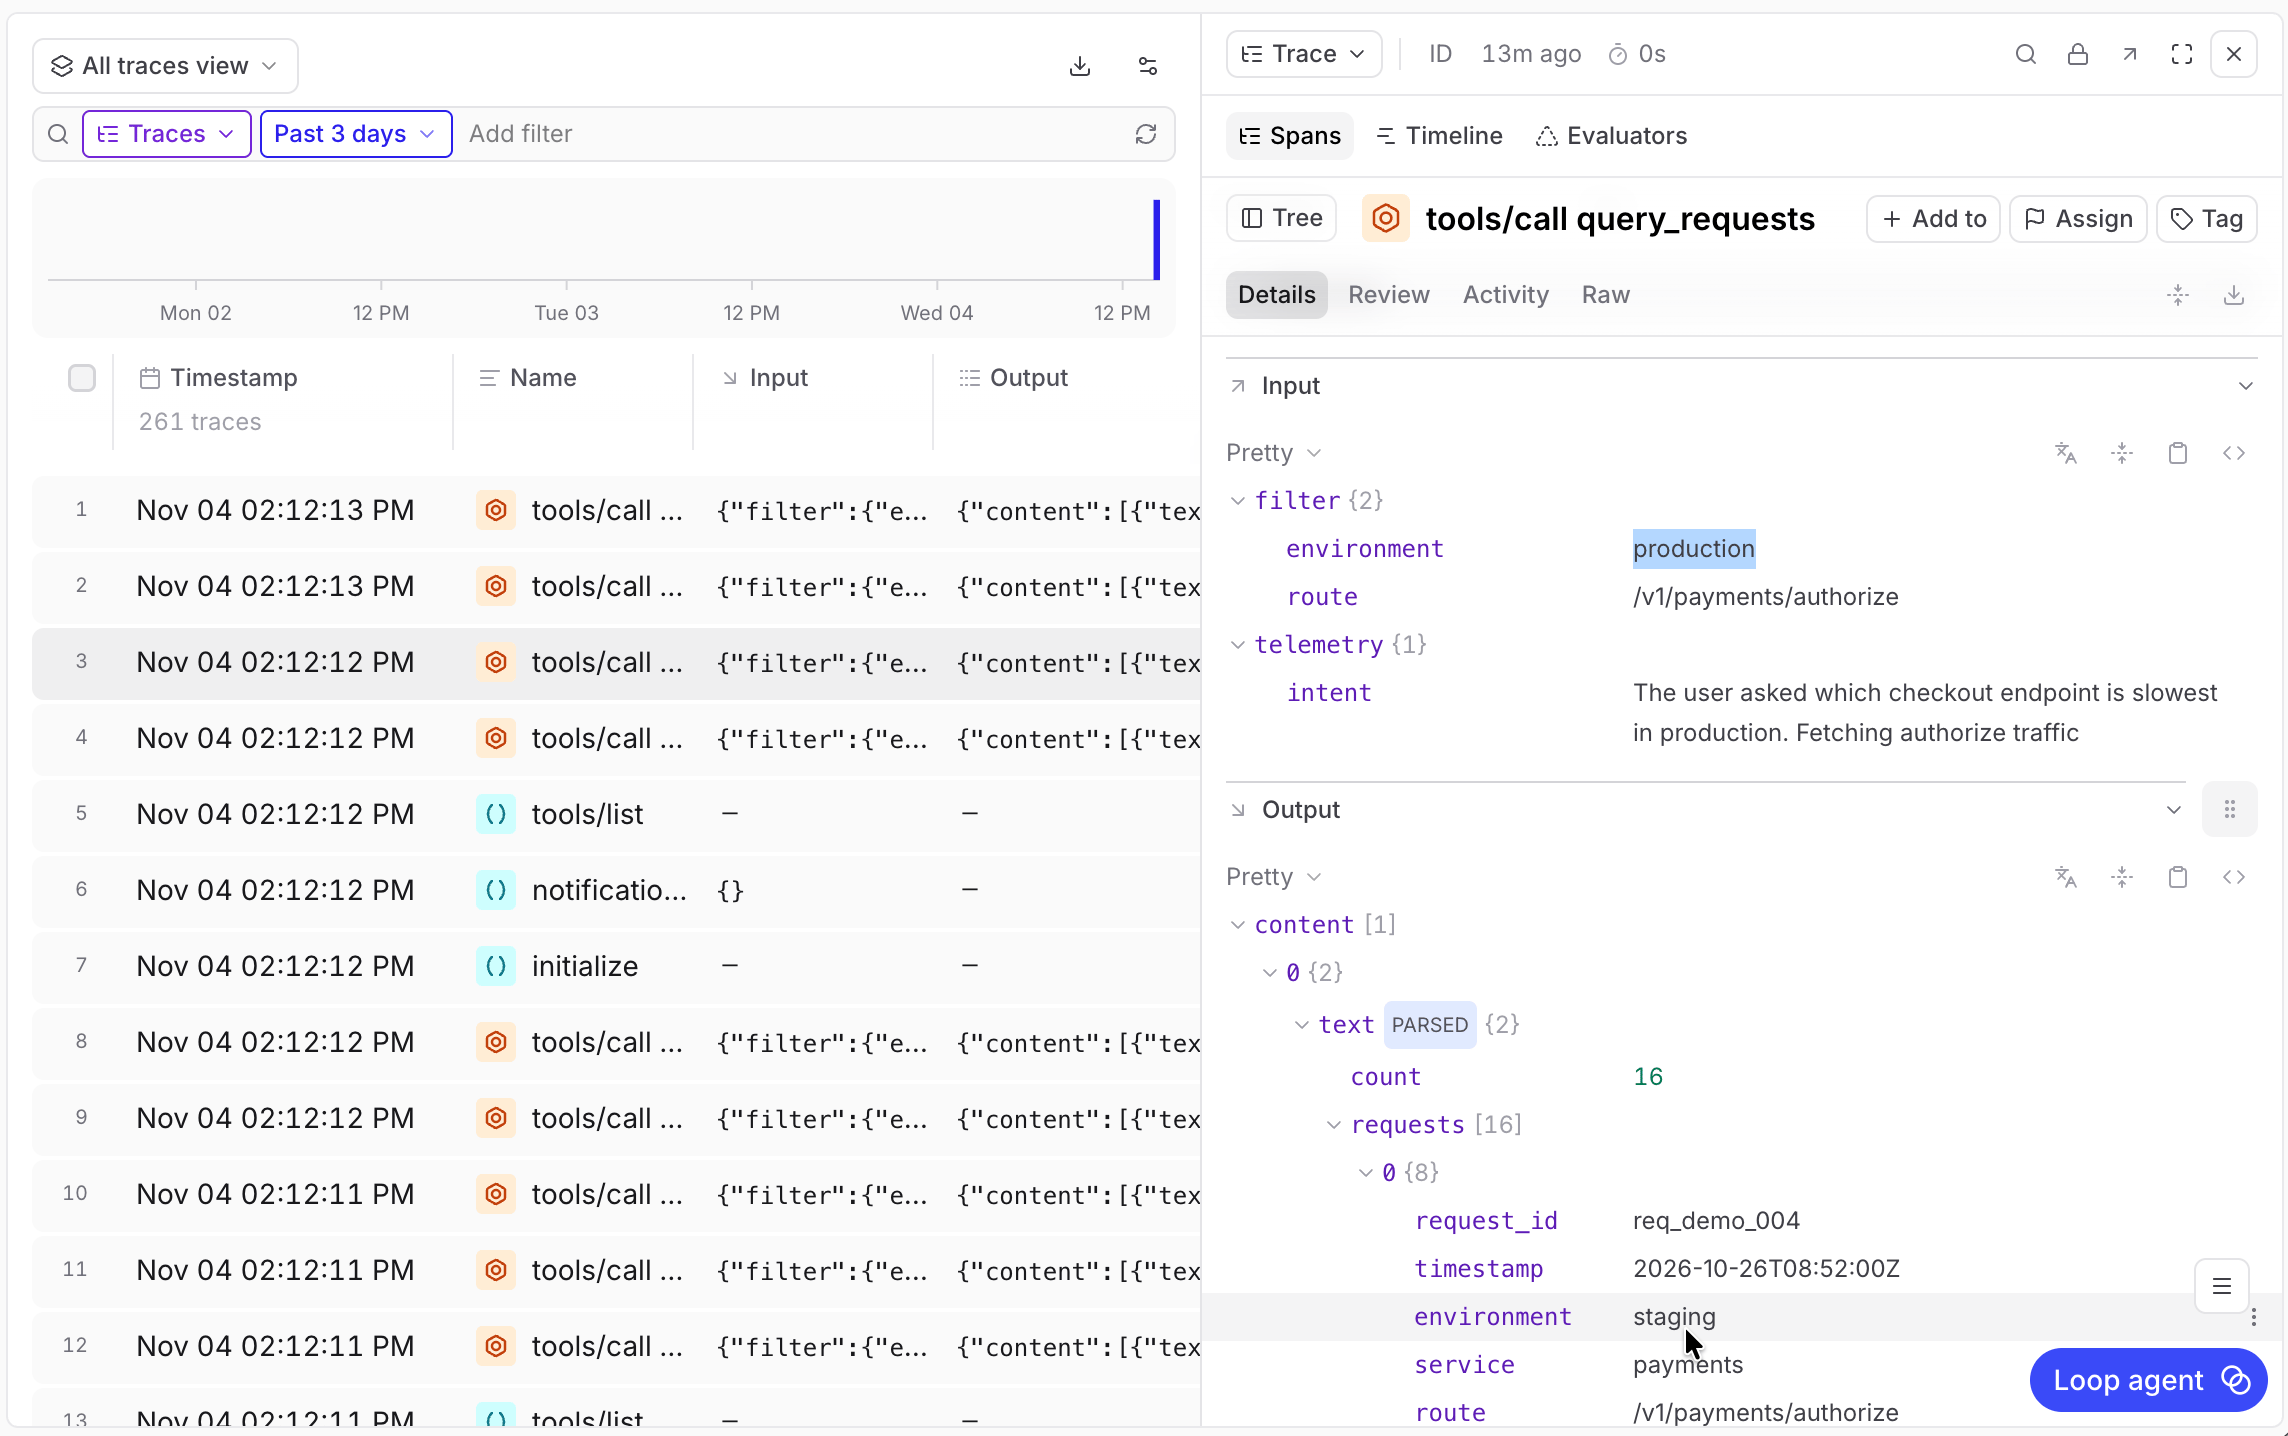
A trace on the Logs page shows an MCP tool returning staging data for a production-only request.
Capture additional context
- Describe their intent when making a tool call.
- Send feedback about problems they encounter, including those they work around.
Agent intent
To understand the task behind a tool call, allow agents to specify theirintent. For example, an agent might specify “Compare production latency before and after a deployment” when requesting performance data.
To add an intent parameter to your tool call and verify that Braintrust records it, follow these steps:
Add an optional intent field
telemetry.intent field for the agent to fill in:- TypeScript
- Python
requestSchema is your existing Zod object schema and queryRequests is your existing MCP handler.extra, the MCP request context, so your handler keeps access to request metadata, cancellation, and progress notifications. If your handler accepts only args, call queryRequests(args) instead.telemetry.Verify the recorded intent
input.telemetry.intent.Agent feedback
An optionalsend_feedback tool lets agents report unexpected results, confusing documentation, or missing capabilities, even when they find a workaround and complete the task. Loop can investigate these reports alongside ordinary tool calls, which can reveal problems agents didn’t notice.
Register a feedback tool
send_feedback to your instrumented server:- TypeScript
- Python
server instance.send_feedback call’s input.Verify that feedback reaches Braintrust
TEST label lets you exclude it from investigations of real usage.tools/call send_feedback span and confirm:input.feedbackcontains the report.input.contextcontains the tool name and arguments.
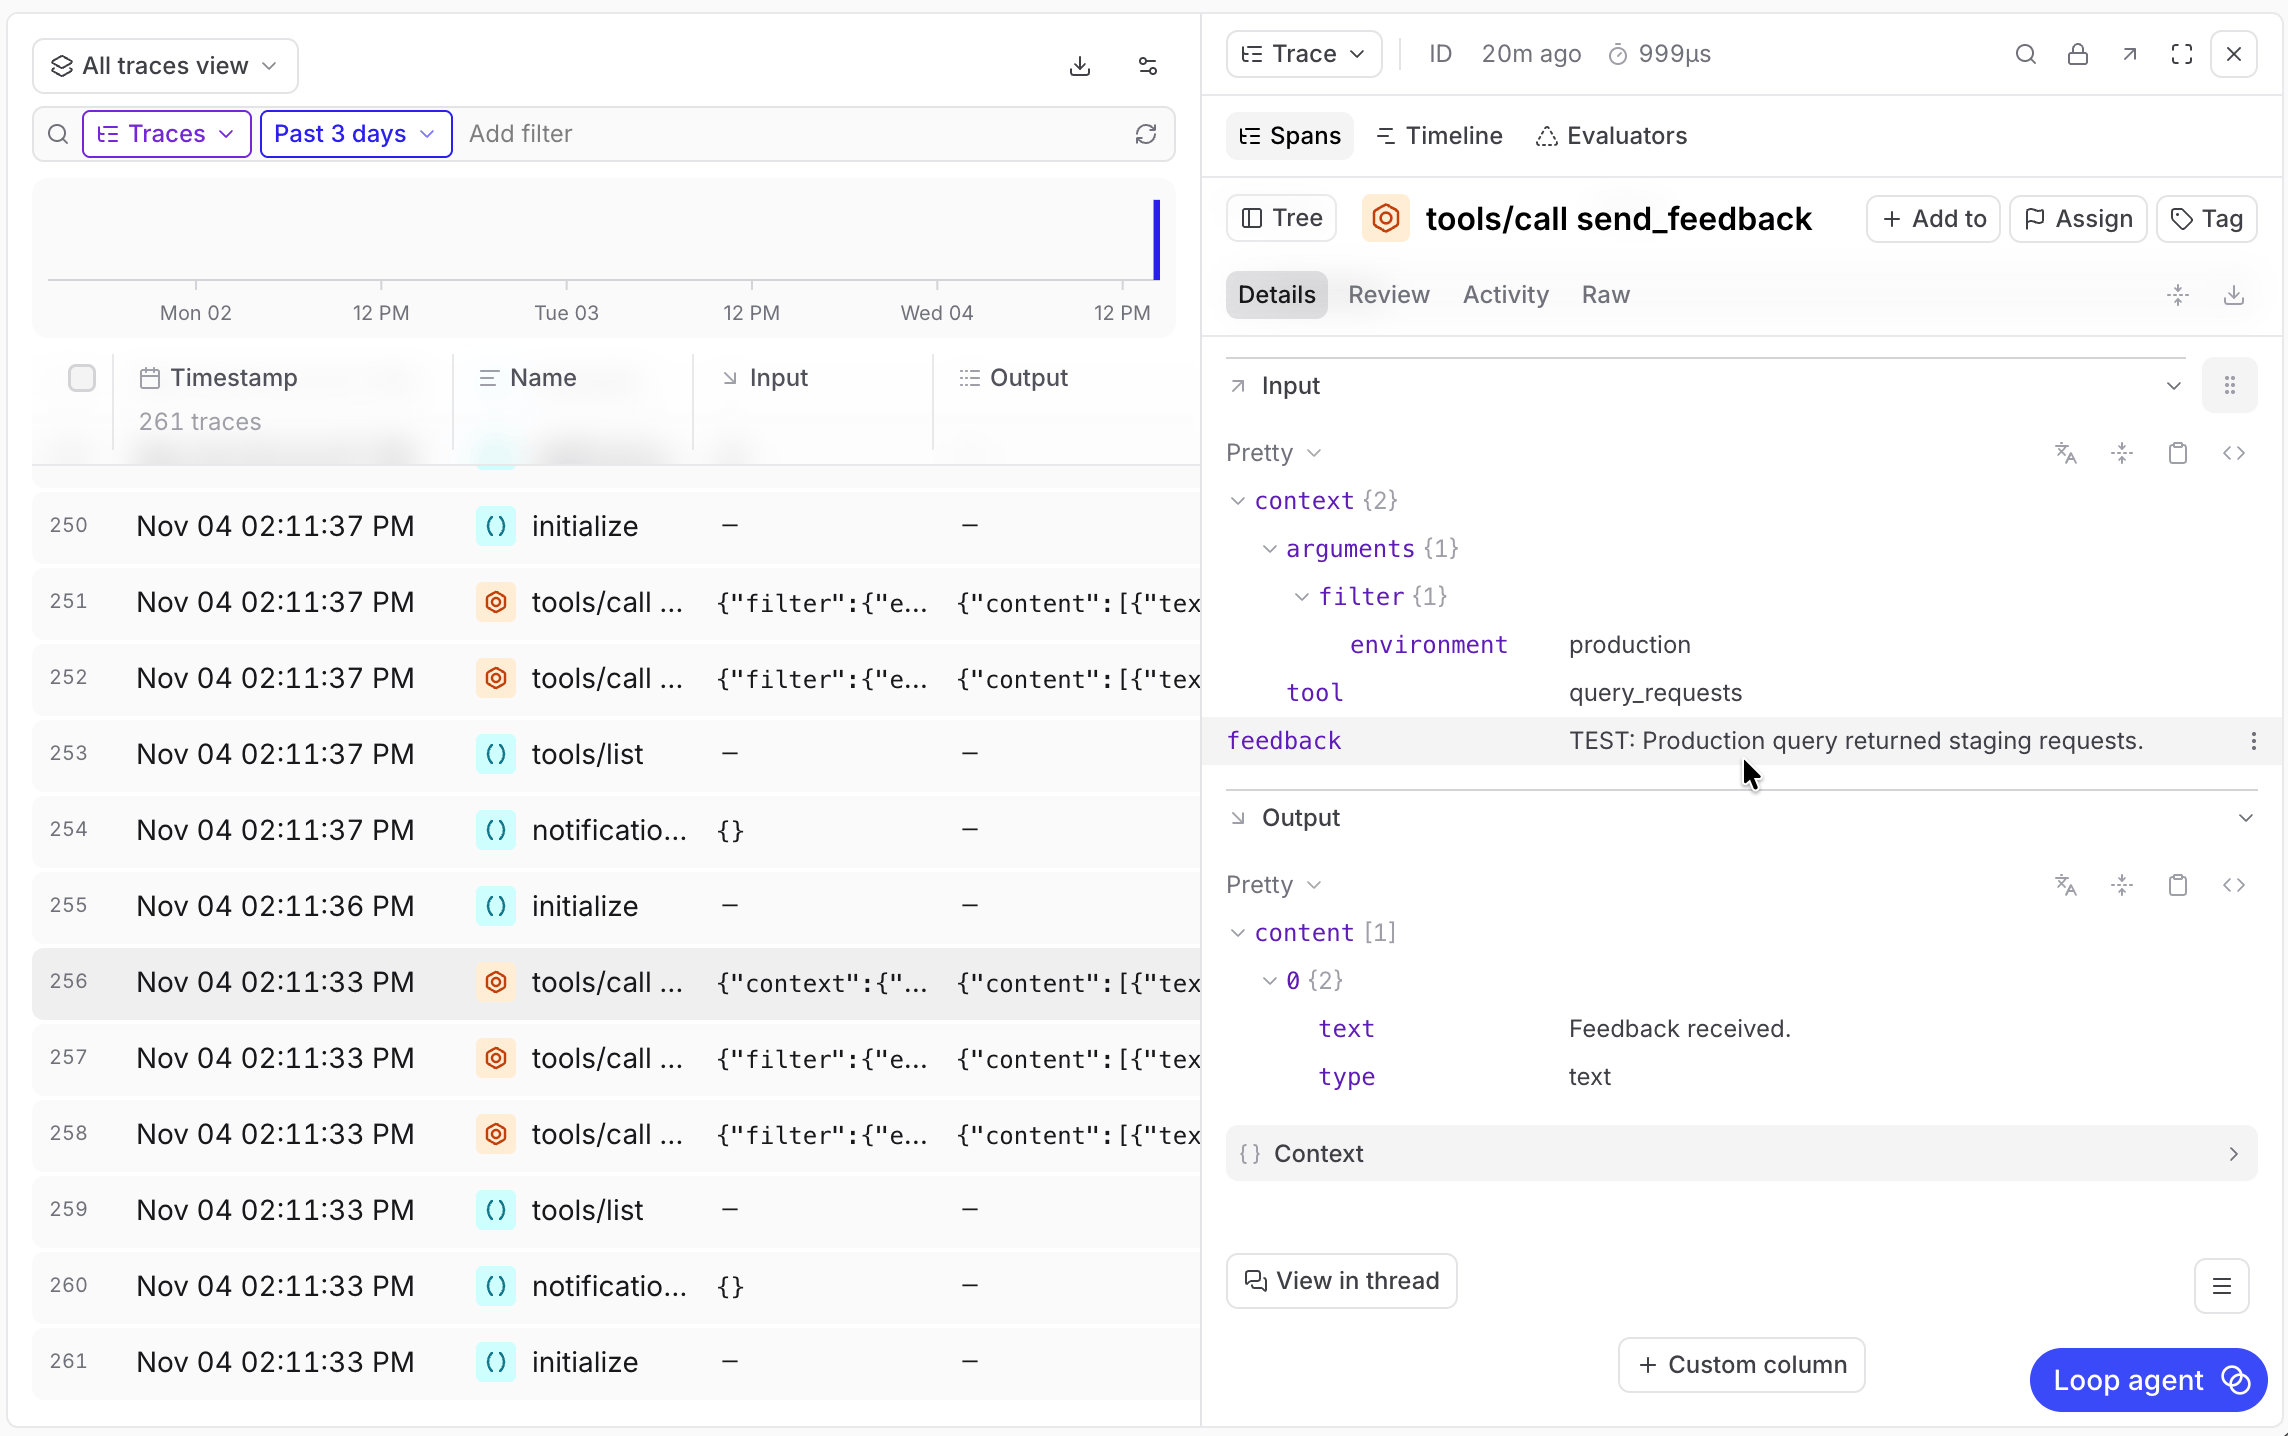
On the Logs page, a send_feedback call records the reported problem, tool name, and query filter.
Find problems with Patterns
Once your MCP server is sending traces to Braintrust, Loop can investigate them for recurring problems and save findings as Patterns, with supporting traces and suggested next steps. For example, in the production-filter scenario above, Loop might find repeated calls that returned staging data despite a production filter. The resulting Pattern would link to those calls so you could inspect the unexpected results and investigate why the filter was ignored.Run an investigation
The steps below enable Patterns and add an investigation focused on MCP calls.Enable Patterns
- If Patterns is already enabled, continue to the next step.
- Otherwise, click Enable Patterns. This creates and starts the default investigation for your project.
Create an MCP investigation
Describe what to look for
Configure the automation
- Frequency: Choose how often Loop should investigate your MCP calls.
- Default query range: Choose how far back each investigation should look. For your first run, include a period when your MCP server received tool calls.
- Write tool permissions: Select
new_patternandupdate_patternso Loop can create findings and update existing ones.
Run the investigation
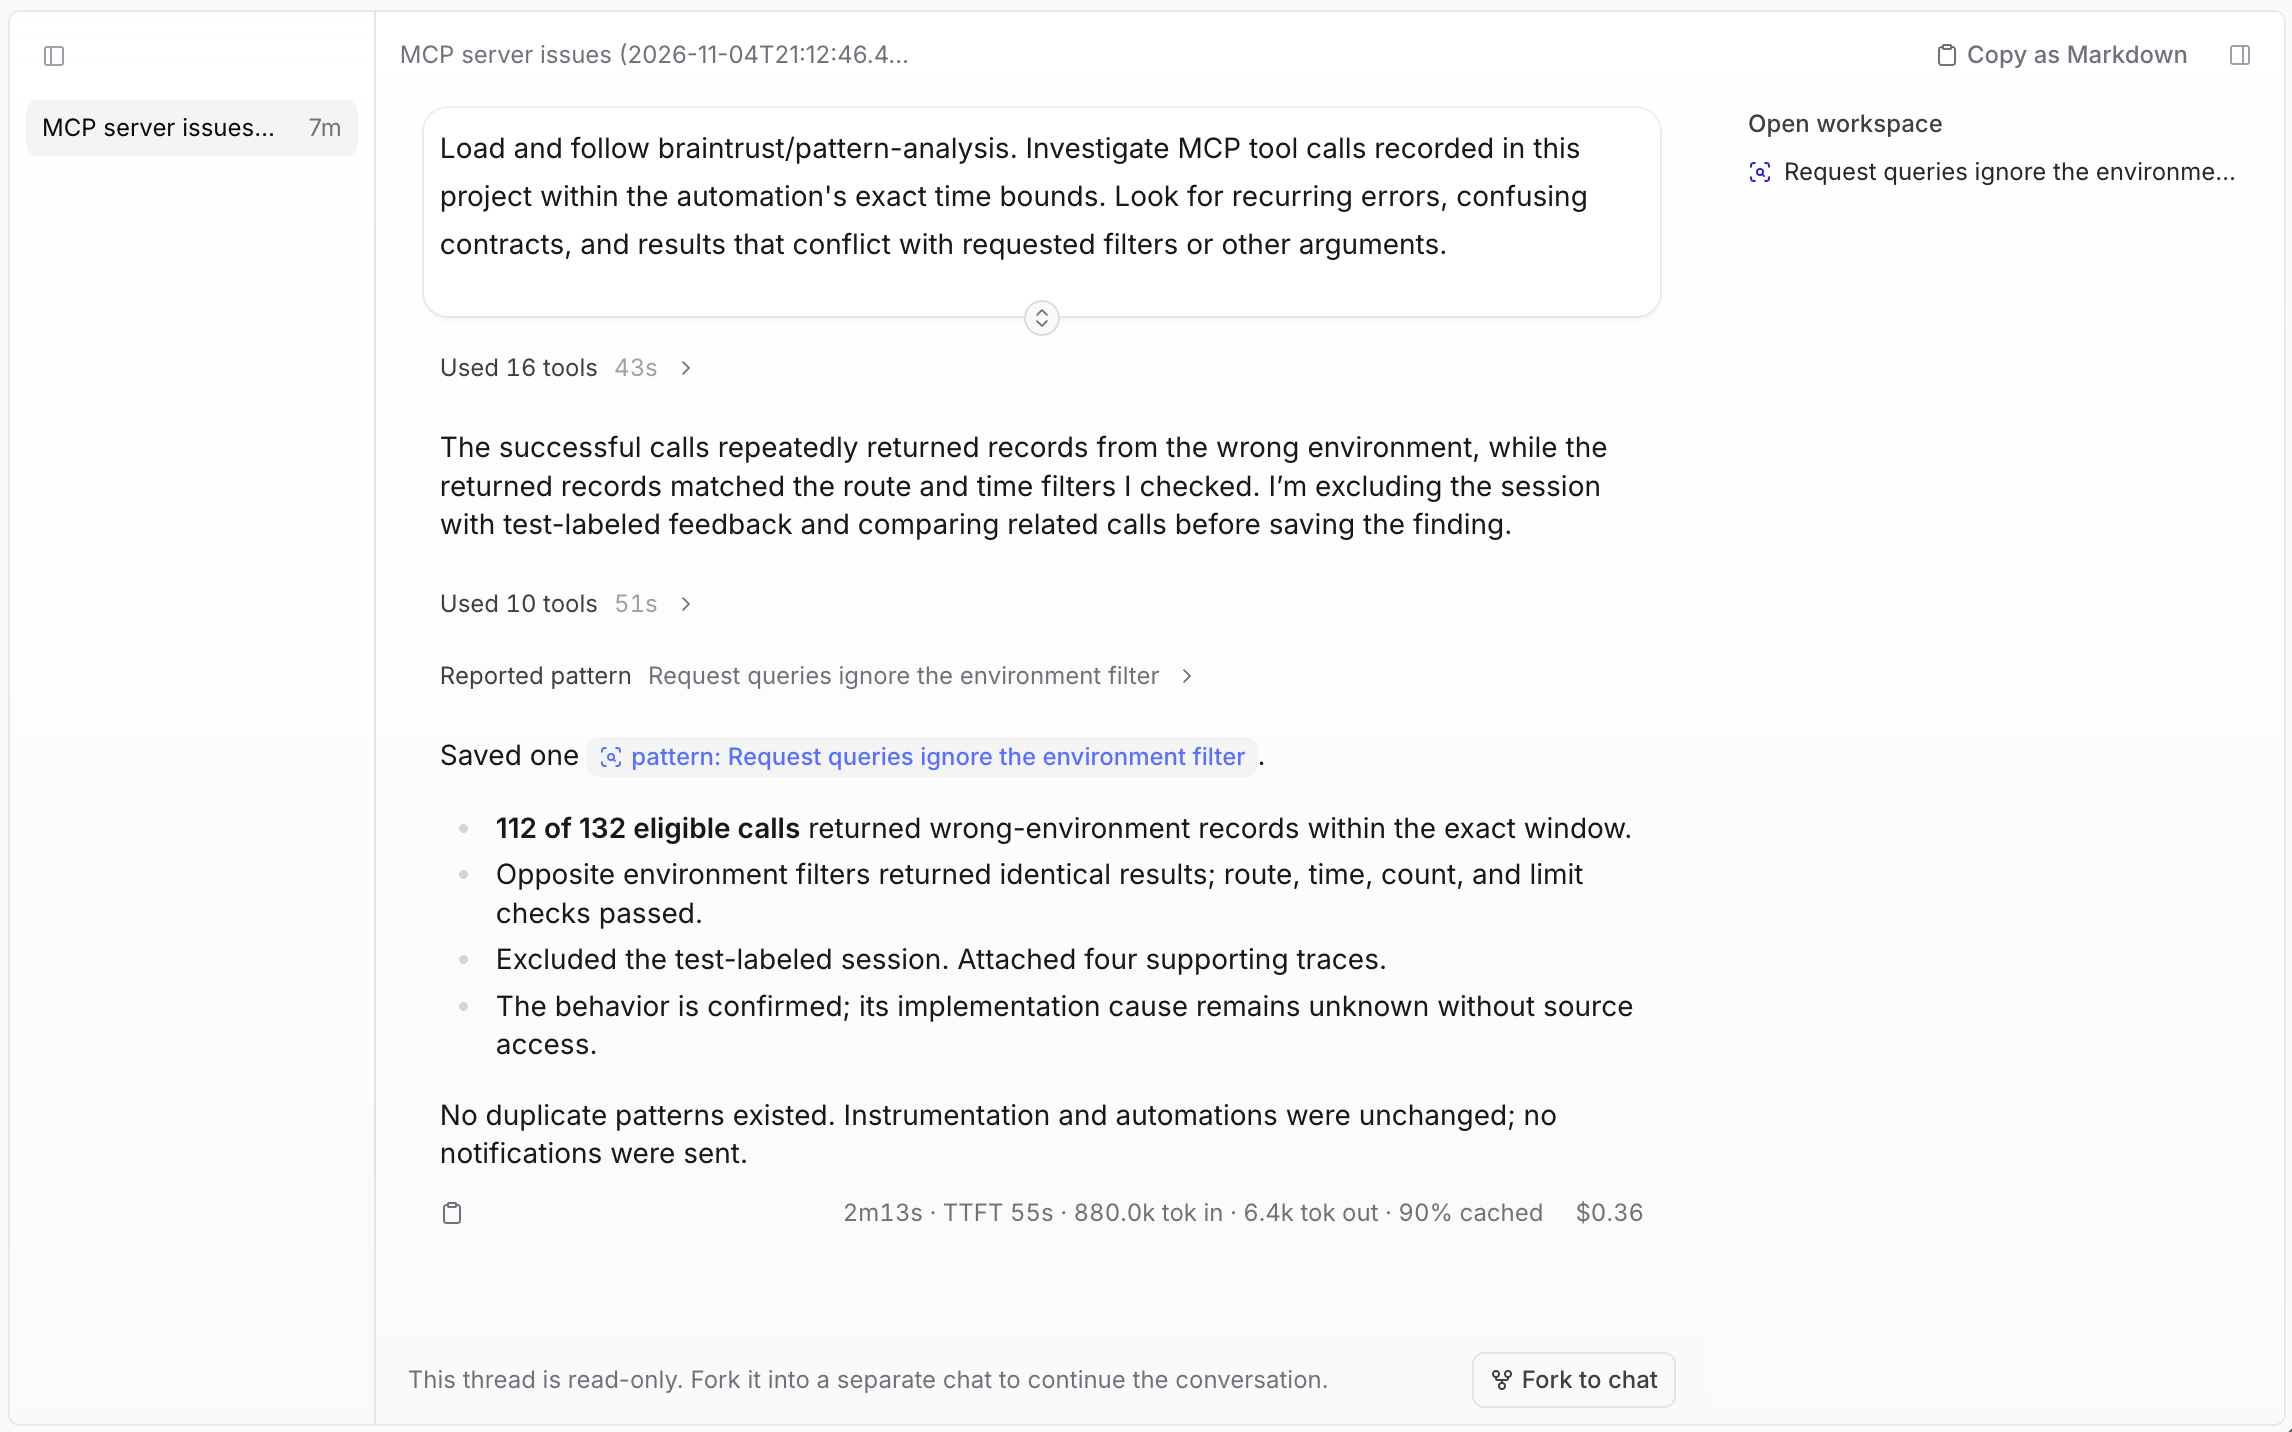
On the Loop page, the investigation finds MCP queries returning unrequested data and saves a Pattern with supporting traces.
Review the results
Review and act on findings
During the run of a Loop automation, Loop investigates your MCP calls and saves findings as Patterns with supporting evidence. You can now review those Patterns, ask follow-up questions, and test changes to your server.Review a finding

Explore the investigation
- Click Fork to chat to continue the investigation with Loop. Ask it to explain the evidence or help plan a fix in a separate, editable chat.
- Click Copy as Markdown to share the investigation with a teammate or give a coding agent context for a fix.
Make and test a change
- Call the tool again through your MCP client, using the input shown in the trace. For example, for the scenario described in this guide, you’d request production data and confirm that no staging rows are returned.
- Ask an agent to try the task again, then inspect its calls to see whether the change addresses the problem it encountered.
Watch for recurrence
- Add an automated test to your MCP server’s test suite that checks the corrected behavior, so future changes don’t bring the problem back.
- Review later traces and Patterns findings to see whether the problem still occurs in real usage.
- Optionally, run an eval using representative tool calls and compare experiments to see how their results change between versions of your MCP server.
Next steps
With traces, intent, and feedback in Braintrust, you can keep investigating how agents use your server and use what you learn to improve it.- Configure Loop automations to investigate traces on a schedule.
- Review Patterns and the evidence behind each finding.
- See the MCP tracing reference for supported libraries and configuration.