

Why observe in Braintrust
Braintrust connects discovering a problem, understanding its cause, and checking whether a fix works:- Discover recurring problems: Patterns uses Loop to investigate traces and surface failures, unmet user needs, and opportunities for improvement. Compare findings by severity and impact to prioritize your work.
- Investigate the evidence: Inspect trace inputs, outputs, and tool calls, or ask Loop to help explain the behavior. With a connected repository, Loop can also examine the code behind a finding.
- Turn findings into evaluations: Add examples from production to datasets and use them to test changes. Logs and experiments share a data structure, so you can reuse instrumentation, scorers, and feedback across production and evaluation.
- Monitor the results: Use online scoring and dashboards to track quality, latency, cost, and recurring behavior after a change.
View your logs
The Logs page displays all traces from your application in a searchable, filterable table. Each row represents a complete trace with its root span.
- Browse traces and individual spans, in the UI or from the terminal with
bt view logs. - Group related traces by metadata or tags.
- Create custom columns to surface important values.
- Extract prompts to iterate in playgrounds.
- Apply tags to organize traces.
- Download logs as CSV or JSON, or pull them locally with
bt sync pull.
Find recurring problems with Patterns
Patterns uses Loop to investigate your traces and find recurring problems and opportunities to improve your application. Each finding includes supporting evidence and suggested next steps. Compare findings by severity, affected traces, and when the behavior last occurred to decide what to investigate first.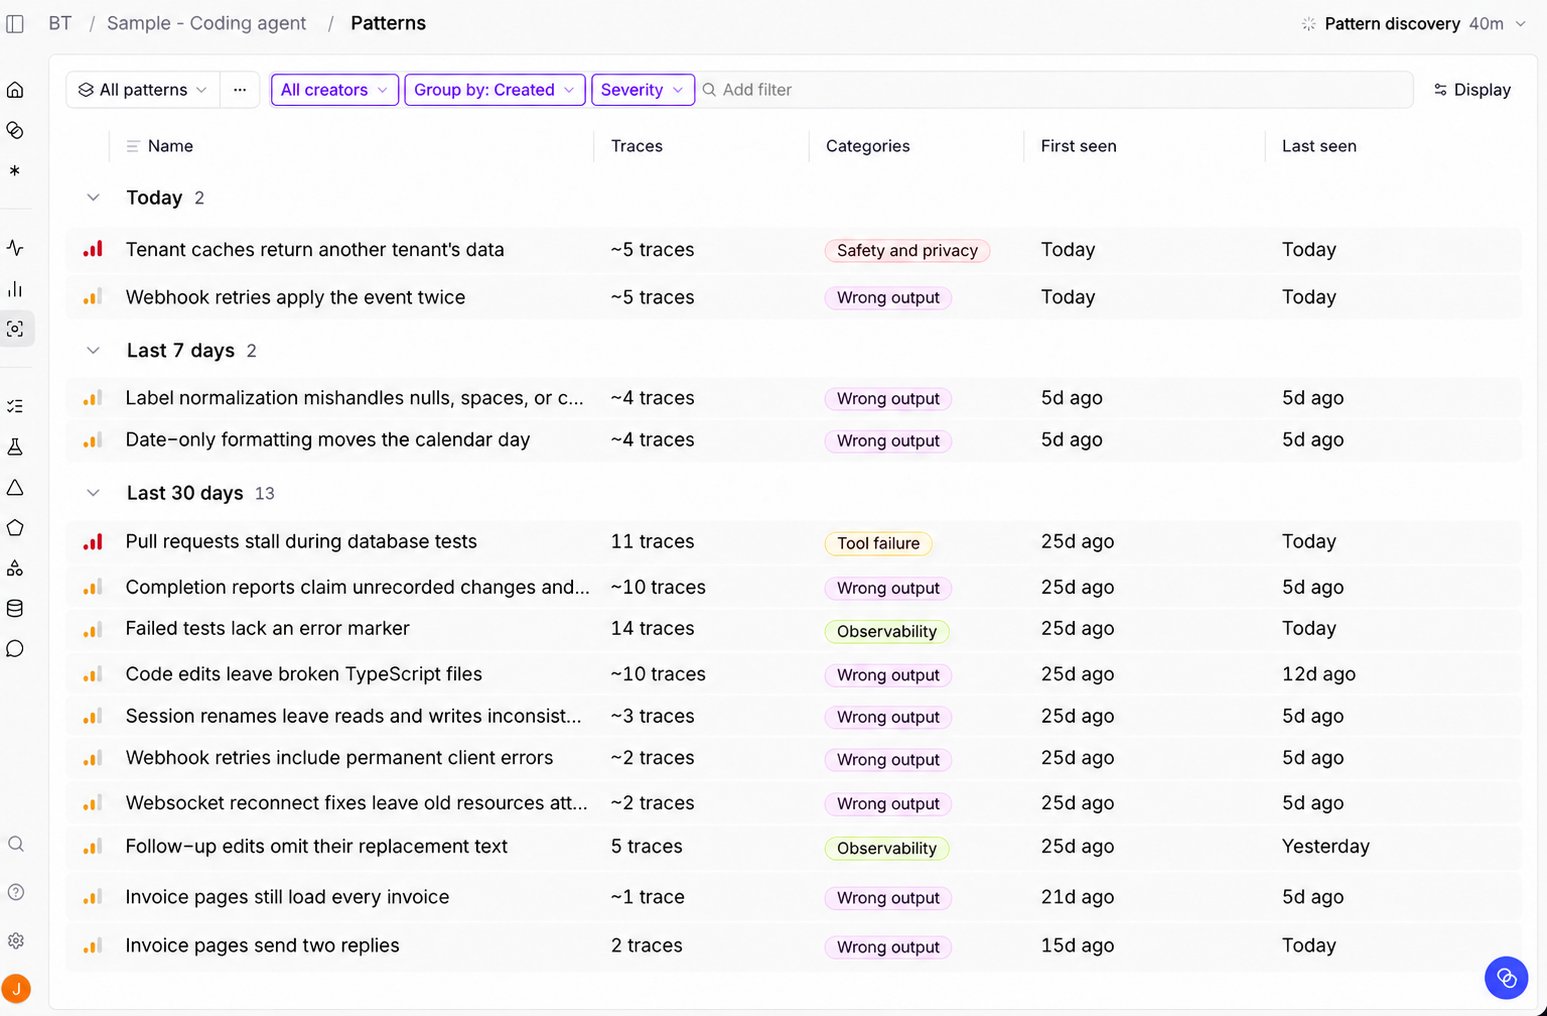
Investigate and improve with Loop
Loop is Braintrust’s AI agent. It understands your data structure, so you can investigate your logs through natural language instead of writing queries. Loop is available on the Logs page, on individual trace pages, and on its own full page, and it powers Patterns. See What Loop can do for the full range, including building datasets, writing scorers, and running evaluations from what it finds.Discover insights with Topics
Topics automatically analyze and classify your logs without manual review. Each trace is analyzed by facets that extract short labels, then similar labels are clustered into named topics like user intents, sentiment, and issues. Use Topics for:- Blind-spot detection: Surface user request types and system gaps you didn’t know to look for.
- Silent failure detection: Catch quality issues that don’t trip explicit checks.
- Product roadmap signals: Cluster real user requests into themes to inform what to build.
- Targeted evaluation datasets: Filter classified logs to build datasets for focused evals.
Monitor with dashboards
Dashboards aggregate metrics across your logs and experiments. Track request counts, latency, token usage, costs, scores, and custom metrics over time. Dashboards help you:- Visualize trends and anomalies
- Compare performance across time periods
- Drill into specific data points
- Share insights with your team
Get notified with alerts
Alerts notify you when logs match conditions, metrics cross thresholds, or prompt and dataset environments change. Send notifications to Slack, PagerDuty, or webhooks so your team can respond. Use log alerts to flag individual errors or low scores, and time window alerts to detect aggregate changes, such as an average score dropping below a target or an error count exceeding a limit. See Set up alerts for requirements and configuration.Next steps
- View your logs in the Braintrust dashboard
- Enable Patterns to surface recurring problems automatically
- Discover insights with Topics
- Use Loop to analyze logs with natural language
- Filter and search for specific traces
- Score online to evaluate production quality